The team at Seahub – Yacht Maintenance Software are thrilled to announce the launch of a new technology aimed at effectively managing new build & commissioning worklists.

If you are on the front foot with preventative maintenance, you already take and analyse oils samples frequently. Lab reports play a big part in analysing the condition of your engines, generators and other lubricant reliant systems onboard.
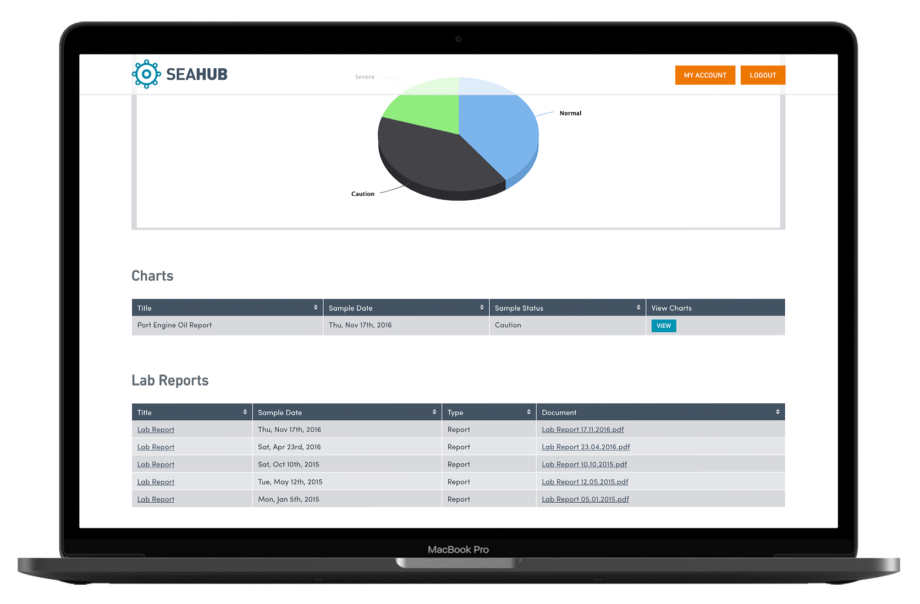
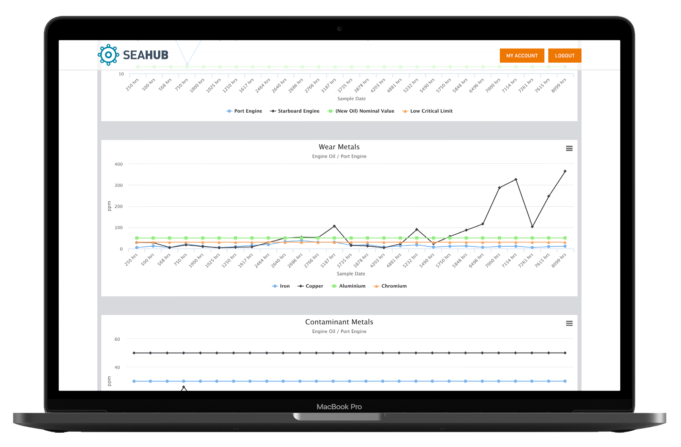
Seahub’s Fluid Analysis module allows lab reports data to be displayed in the form of interactive charts with dynamic viewing options and manufacturer recommended limits and thresholds.
Extracting and analysing oil samples have been a standard procedure for a long time onboard superyachts and in the wider marine industry. Other heavy machinery dependant industries like mining and large-scale agriculture, invest heavily into the sampling and analysis of fluid results of their critical equipment. Our experience with oil sampling recognised there were limitations and a limited number of tools available for those taking samples, to receive historical or dynamic data of their samples.
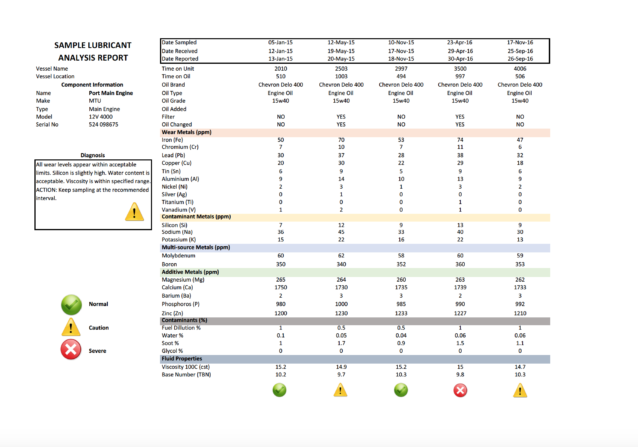
Typically, samples in the form of lab reports are returned from the lab with a table of values with an overall classification of either normal, caution or severe. The real power of sampling and analysing oil samples is in the ability to perform trend analysis or viewing the data over a period of time to recognise a trend or pattern. The current process or industry norm, we felt, was failing to deliver that functionality to the market.

Seahub has bridged the gap between what was being provided and what was needed to understand the value of the data by providing a platform, to not only store historical sampling data, but reproduce it in a series of charts which are highly customizable.
“We worked very closely with manufactures to understand what are considered to be normal operating ranges and acceptable limits. We then provide this information to our users via our dynamic charting system to further aid the process of deciphering the data” says Seahub director Sam Wheaton.

Seahub’s Fluid Analysis module has been widely accepted and recommended as a pivotal tool for any proactive maintenance program. We see it used not only in a preventative maintenance environment but also as a resale tool for programs that which to display mechanical performance and reliability of its components, over a period of time.
“During my time as a chief engineer, we had a situation where all three generators were showing elevated silicon levels within its lubrication system. In turn, we saw it affecting wear metals rates, particularly aluminium. I actually needed to create some charts manually in Excel, just so I could try and figure out what was going on over a period of time. Now, with Seahub, the process is simplified and an entire engines history of data can be seen in just a few charts” says Seahub director Matt Hyde.
Coming from a yacht engineering background, both founders of Seahub saw the importance of creating an oil analysis platform that was combined with a planned maintenance system. Seahub’s Fluids module is integrated into your account and displays interactive charts for a number of critical parameters including viscosity, wear metals, containment metals and contaminants including water, fuel and soot. Seahub fluids module brings your lab reports to life.
To take a look at Seahub’s free demo to see how dynamic charts can work for you. Visit https://seahubsoftware.comfor more information.


